SPSS On-Line Training Workshop |
 |
|
SPSS On-Line Training Workshop |
|
|
 In this Tutorial:
|
Interactive graphs can be obtained by clicking on “Graphs” menu and selecting “Legacy Dialogs” and then “Interactive”. Then, select the type of desired graph. To create a simple Pie Chart, select “Pie…” after selecting “Interactive” and then select “Simple”. This is illustrated by the Math Assessment data set.
|
Creating an Interactive Pie Chart
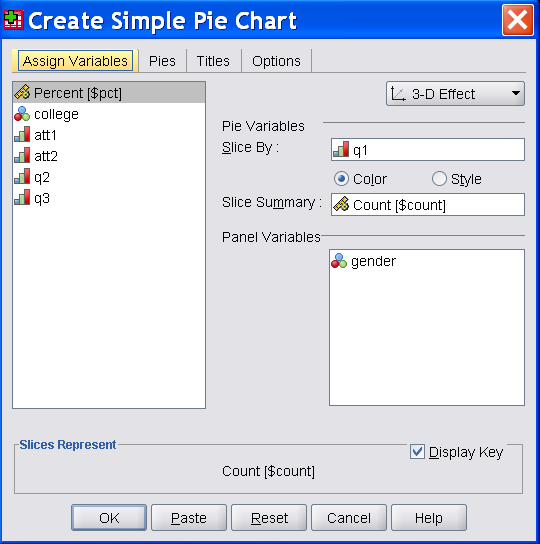
| On the following dialog is
the dialog box to create a simple interactive pie chart.
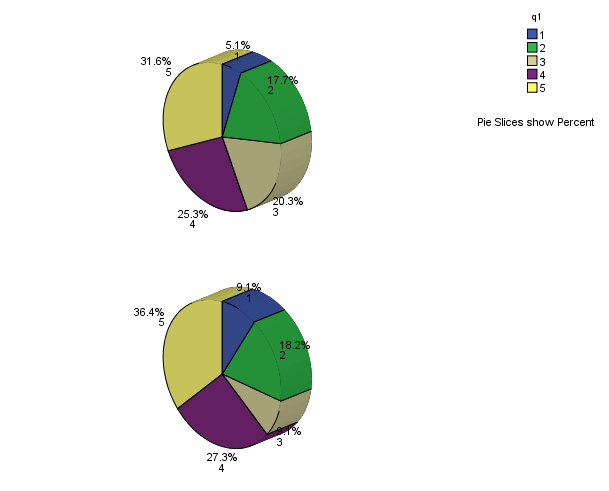
The variable for the pie chart is 'q1'. Drag and drop q1 to 'Pie Variables Sliced By:' box. 'Slice Summary' is count by default. You can change it to percent or others by going to 'Pies' Menu. Panel Variables are the variables you would like to use to split the data based on the categories of the Panel Variables. In the above example, we want to create a pie chart for variable 'q1'. Slice summary has been changed to 'Percent'. This is done by dragging 'Percent ($pct) into 'Slice Summary', which is shown on the left panel. Two pie charts will be created based on the Panel Variable, Gender. Observe that symbol for "Percent" shows that it is an SPSS built-in variable. The effect of the Pier chart can be either 2-D or 3-D. In this example, 3-D is selected. The output is given below. |
Editing an Interactive Pie Chart
| After creating
an interactive graph, the result is stored in the Output
Window, which is shown below.
By double clicking on the graph, a Chart Editor window appears. Instead of double clicking, you can also right-click on the chart and select “Edit Content” and then select “In separate window”. The editor has three horizontal rows of toolbars on the top. These toolbars provide shortcut icons. Moving the cursor to an icon, a text label will show the function of the icon. To edit the graph, simply double click on the part of graph you want to edit, and a “Properties” dialog box will appear for you to make changes. After making the changes, click on “Apply” to effect the changes and then close the dialog box. You can also right-click on the graph to edit it. After finishing the editing, close the Chart Editor window to go back to the Output Window. |
![]()
![]()
©This online SPSS Training Workshop is developed by Dr Carl Lee, Dr Felix Famoye and student assistants Barbara Shelden and Albert Brown , Department of Mathematics, Central Michigan University. All rights reserved.