SPSS On-Line Training Workshop

SPSS On-Line Training Workshop |
|
|
Chart Editor Window: Interactive Bar Charts |
 In this Tutorial:
|
Interactive graphs can be obtained by clicking on �Graphs� menu and selecting �Legacy Dialogs� and then �Interactive�. Then, select the type of desired graph. To create a Bar Chart, select �Bar�� after selecting �Interactive� This is illustrated with the Math Assessment data set. |
Creating an Interactive Bar Chart
 On
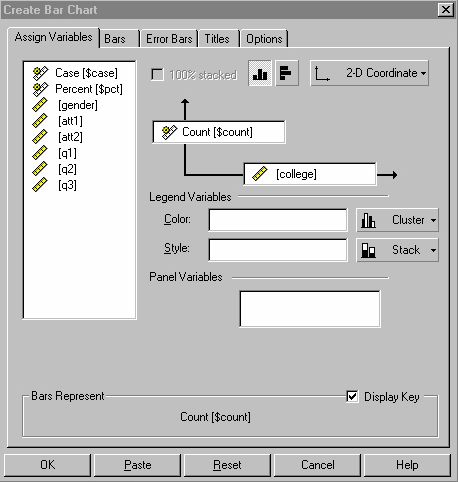
the left is the dialog box to create a simple interactive bar chart. On
the left is the dialog box to create a simple interactive bar chart.
Three types of variables are shown for
interactive graphs: The built-in data type, count, is given by default for the vertical dimension of this chart. However, you must drag and drop the variable that you want to use on the horizontal axis. The variable "college" has been dragged, and dropped in the horizontal axis box. Click OK |
Editing an Interactive Bar Chart
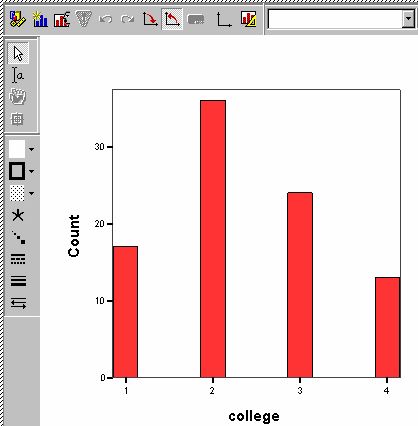 After creating
an interactive graph, the result is stored in the Output
Window. By double clicking on the graph, an interactive
Chart
Editor Window appears. After creating
an interactive graph, the result is stored in the Output
Window. By double clicking on the graph, an interactive
Chart
Editor Window appears.
The editor has a horizontal bar on the top and a vertical bar on the left side. These bars provide shortcut icons. Moving the cursor to an icon, a text label will show the function of the icon. To edit the graph, simply double click on the part of graph you want to edit, and a dialog box will appear for you to make changes. After finishing the editing, click on anywhere outside the Chart Editor to go back to the Output Window. |
![]()
![]()
©This online SPSS Training Workshop is developed by Dr Carl Lee, Dr Felix Famoye and student assistants Barbara Shelden and Albert Brown , Department of Mathematics, Central Michigan University. All rights reserved.